Why a page-level audit beats a site-wide panic
A site-wide traffic chart is the wrong altitude. It tells you something is wrong, but not where, so it drives panic rather than action. The useful truth lives one level down, in the individual pages that gained, held or lost.
Losses are never spread evenly. A handful of pages usually account for most of the damage, and those pages are rarely the ones you would guess. Some pages that dropped never earned leads anyway, while a single high-value page quietly bleeding clicks can explain your whole revenue dip. Only a page-level view separates the two.
That is why the audit is worth the hour. It converts a vague, stressful decline into a specific, ranked list of pages to act on, and it keeps the work tied to money rather than to the scariest-looking line on a graph. Done well, it becomes the backbone of your answer engine optimisation plan.
There is a psychological benefit too, which is easy to underrate. A site-wide drop feels like a crisis with no handhold, and crises push teams into hasty, expensive over-reactions. A ranked list of a dozen named pages feels like a task, and tasks get done calmly and well.
The same drop, viewed at the right altitude, changes from something that happens to you into something you manage, and that shift alone tends to produce better decisions.
What an AI Overview casualty actually is
Define the target before you hunt for it. An AI Overview casualty is a specific page that still ranks and is still shown, but has lost clicks because an answer now sits above it and satisfies the searcher.
The signature is precise. Impressions hold steady or even rise, average position stays stable, but clicks and click-through fall. Ahrefs describes this split of steady impressions and falling clicks in its guidance on tracking AI Overviews, and it is the exact fingerprint you are auditing for.
The page did nothing wrong, the results page changed around it.
This is different from a page that simply lost ranking, where impressions and position fall too. Keeping that distinction sharp matters, because only the casualty responds to AI-focused fixes, while a ranking loss needs content and quality work instead. The audit sorts one from the other page by page.
It is worth naming the two lookalikes that trip people up. The first is a page that lost clicks purely to seasonality, which will show clicks and impressions falling together and then recovering, unlike a casualty whose impressions hold.
The second is a page that lost clicks because a competitor overtook it, which shows your average position slipping. Neither is an overview casualty, and treating them as one wastes effort.
The four metrics, read together per page, tell these stories apart, which is exactly why the audit works at the page level rather than the site level.
Step one: export your pages from Search Console
Start with the raw data. Open the Search Console Performance report, switch to the Pages view, and set a date range that spans well before and after your drop so the change is visible.
Google's documentation on the Performance report explains how to read clicks, impressions, average position and click-through for each page, and how to compare periods. Export the page-level table for the period after the drop against an equivalent period before, so you have both sets of numbers side by side.
The goal at this stage is simply a spreadsheet with one row per page and its before-and-after clicks, impressions, position and click-through. Everything that follows is sorting and labelling that list, so getting a clean export now saves you time later.
Choose your two periods with care, because a sloppy comparison poisons the whole audit. Match their length, avoid straddling a major seasonal event or a site migration, and make sure both sit either side of the drop rather than overlapping it.
A clean, like-for-like pair of periods is the difference between a spreadsheet you can trust and one that quietly misleads you into fixing the wrong pages.
Step two: find the click-loss signature per page
Now read each page against the casualty fingerprint. For every row, compare the before and after periods across the four metrics, and flag the pattern.
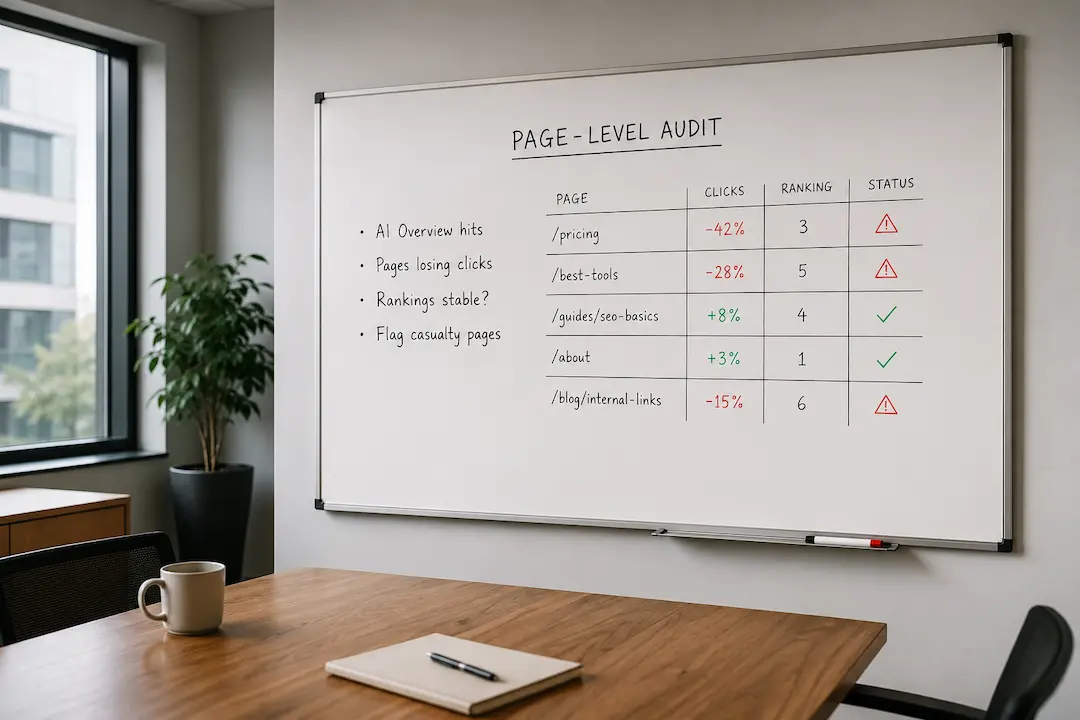
A page is a likely casualty when its clicks and click-through fell while its impressions and average position stayed roughly flat. That is the decoupling of rank from traffic that defines the squeeze.
A page whose impressions and position also fell is a different case, a ranking or relevance problem rather than an overview, and you label it as such. DataReportal's figures on how much of search behaviour now runs through an increasingly AI-shaped experience explain why so many pages now show this pattern at once.
Sort the list by lost clicks, biggest first. That single sort turns a wall of data into a priority order, and the pages at the top are where your attention belongs, which our guide to measuring AEO return helps you frame in revenue terms.
Add a simple flag column while you are here, marking each page as a likely casualty, a ranking loss, or unchanged. Doing the labelling as you scan, rather than in a separate pass, keeps the judgement fresh and stops you second-guessing later.
It also surfaces the surprises early, the page you assumed was fine that is quietly bleeding clicks, and the one you feared was a disaster that turns out to have simply followed a seasonal dip. Those surprises are usually where the real value of the audit hides.
Step three: confirm which pages trigger overviews
Data implies the cause, but a live check confirms it per page. Take your top suspected casualties and run their main queries in a real search to see what sits above the result.
Where an AI Overview or answer feature now occupies the space your page used to own, you have a confirmed casualty. Tools can scale this beyond a manual check, and Ahrefs and others describe how to track which of your queries and pages trigger overviews so you are not checking each by hand.
Semrush's guidance on AI Overview traffic loss is a useful companion for turning that confirmation into a plan.
Do enough live checks to trust the pattern, especially for your highest-value pages. Overviews vary by query, location and phrasing, so seeing what your customers actually see is what separates a confirmed casualty from a suspected one.
Note how you appear in each overview as well as whether one is present.
There is a meaningful difference between a page that is cited inside the answer and one that is ignored while a competitor is named, and the fix differs accordingly.
A cited page needs a nudge towards prominence and the remaining click, while an ignored page needs to become citable in the first place. Capturing that detail during the live check saves a second pass later and makes the action plan sharper.
Step four: categorise every page
With the data and the live checks in hand, sort each page into one of three buckets. This is the heart of the audit, and it makes the action plan obvious.
| Category |
What it looks like |
What it needs |
| Casualty |
Clicks down, impressions and position steady, overview present |
Get cited, capture remaining clicks |
| At-risk |
Still earning clicks, but overviews appearing on its queries |
Strengthen and future-proof before it slips |
| Safe |
Clicks steady, no overview on its queries |
Protect and use as a click-earning channel |
Mark each row with its category, ideally with a colour so the picture is readable at a glance. The casualties are your recovery work, the at-risk pages are your prevention work, and the safe pages are where you can still count on clicks.
Search Engine Land's data on how AI Overviews hurt click-through is a reminder that today's at-risk page is often tomorrow's casualty, so the middle bucket matters as much as the first.
Step five: score and prioritise by revenue
Not every casualty deserves equal effort, so add a value lens. Beside each casualty, note how much that page mattered to the business: leads, sales, sign-ups or assisted conversions, not just raw traffic.
Rank the casualties by that value, not by the size of the click drop. A page that lost a few high-intent clicks that used to convert is worth more than one that lost a flood of visitors who never did.
The web analytics discipline of tying pages to outcomes, rather than to sessions alone, is exactly what connecting pages to real value is about, and it keeps this audit honest.
The output is a short, ranked list of the pages that both lost clicks and mattered to revenue. That list, not the site-wide chart, is your plan.
Keep the list short on purpose. It is tempting to try to fix everything, but a focused effort on the top five or ten casualties will almost always beat a thin effort spread across fifty.
The pages further down the ranking are not ignored, they are simply queued, and many of them will be resolved by the same structural improvements you make to the leaders. Discipline about order is what turns a long, daunting audit into a series of quick, satisfying wins that visibly move the numbers.
What to do with each category
Each bucket has its own play, so match the fix to the label. Doing this keeps you from over-investing in the wrong pages.
For casualties, work to be the cited source in the overview and to convert the clicks that remain, which is the core of turning lost traffic into AI citations.
For at-risk pages, strengthen them now, adding direct answers and structure so they earn citations before they lose clicks, guided by how you optimise for AI Overviews. For safe pages, protect them and lean on them, since they are where a reliable click is still on offer.
Spread the recovery across surfaces too. Being visible in ChatGPT search and Perplexity means a casualty on Google can still earn attention elsewhere, so a page losing the Google click is not lost everywhere at once.
Give Google's own AI answers the same attention, and understanding how ChatGPT selects sources helps you become the page each engine reaches for. A casualty recovered across several surfaces is more resilient than one propped up on a single channel.
Keep the audit live
This is not a one-time exercise. Overviews expand to new queries constantly, so a safe page can become at-risk and an at-risk page a casualty within a month. A static list goes stale fast.
Re-run the audit on a regular cadence, monthly for most sites, and watch pages move between buckets. Start from your home base and let a structured AI visibility audit formalise the process across your whole site.
Tie it to your AI SEO plan so each round of fixes builds on the last, and pair it with a broader generative AI visibility audit to keep the whole site in view rather than just the pages you already suspect.
Our case study shows how a page-level, revenue-ranked approach recovers traffic far faster than treating the drop as one big problem, because the effort lands on the pages that actually move the numbers.


.svg)
.svg)
.svg)
.svg)
.svg)



.svg)

.svg)


.svg)
.svg)
.svg)

.svg)
.svg)