Why a small traffic drop can gut your leads
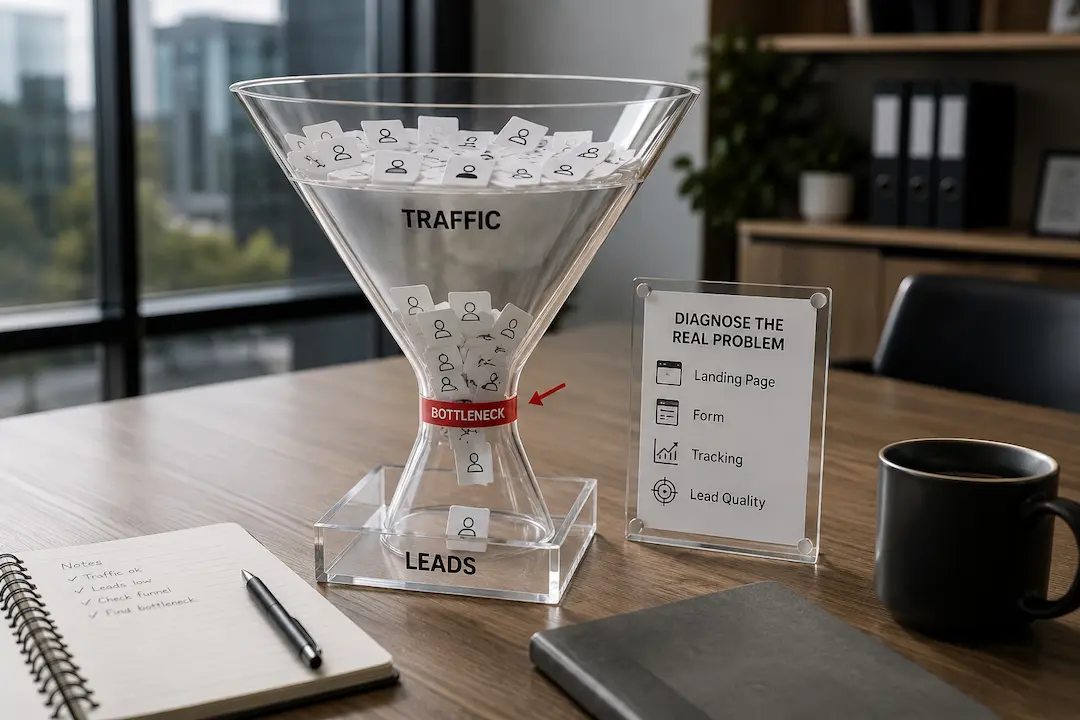
The instinct is to expect leads to fall in line with traffic. Lose 10% of visits, lose about 10% of leads. When the reality is a 10% traffic dip and a 50% lead collapse, the maths feels broken. It is not. It is telling you something specific, and learning to read that signal is the difference between fixing the cause and treating the symptom.
Leads are not spread evenly across your traffic. A small share of visits, from the right pages, the right queries and the right intent, produces most of your enquiries. The rest is browsing, research and noise that rarely converts.
This concentration is the whole reason a minor drop can be catastrophic: if the slice you lost was your high-converting slice, the lead impact is many times the traffic impact.
Think of it like a shop where most sales come from a few motivated buyers who walk in knowing what they want, while the rest are window shoppers. If a road closure turns away mostly the motivated buyers and leaves the browsers, your footfall barely changes but your takings crater.
Your website works the same way, and the road closure is whatever intercepted your highest-intent visitors before they reached you.
The data backs this up. As an ever larger share of searches now end without a click at all, tracked in Statista's zero-click search data, the visits you keep are often not the valuable ones you lost.
A visit is not a visit. So the real question is never how much traffic you lost, but which traffic, and that is what diagnosis is for. It is also why this problem sits inside answer engine optimisation rather than generic SEO.
First, rule out a measurement problem
Before you chase a cause, confirm the loss is real. A surprising share of dramatic lead drops turn out to be broken tracking, not broken demand, and fixing analytics is far cheaper than rebuilding a funnel.
Check whether a recent site change, consent banner, form migration or analytics update coincided with the drop. A form that silently stopped firing its conversion event will show leads falling off a cliff while enquiries actually keep arriving in your inbox.
Cross-check your analytics against the raw source of truth, whether that is your CRM, your inbox or your phone log.
Attribution is the other trap. Ruler Analytics' work on multi-touch attribution shows how last-click models misassign credit, so a change in how a lead is counted can look exactly like a change in how many leads you get.
Confirm the leads are genuinely gone before you diagnose why, because half of all panics end here.
Give this step real time rather than rushing past it. Pull the actual lead records for the affected weeks and count them by hand if you have to. Compare the total your dashboard reports against the number of genuine enquiries that reached a human.
When those two numbers disagree, you have a reporting fault to fix, not a demand problem to solve, and you have just saved yourself weeks of chasing a cause that was never there.
Diagnose which traffic you actually lost
Once the loss is confirmed, stop looking at the total and start segmenting. The site-wide number hides everything you need to know, and the answer is almost always in the breakdown.
Google's own method for this is a good backbone. Its guide to debugging search traffic drops walks through isolating the loss by page, query, country, device and search type, so you can see whether the decline is broad or concentrated.
Concentrated is what you are hoping to find, because a specific loss has a specific fix.
Pull your top lead-driving pages and check each one individually. Did your highest-converting pages lose traffic, or did the loss land on low-intent posts that never converted anyway?
If your best pages held and your leads still fell, the cause is downstream. If your best pages took the hit, you have found your culprit and the rest of the diagnosis is about understanding why, which our guide to measuring AEO return helps you frame in revenue terms.
The intent shift: losing your best visitors, keeping the rest
Here is the pattern behind most modern versions of this problem. Your traffic total barely moved, but its composition changed, and you quietly lost the high-intent visitors while keeping the low-intent ones.
AI answers are the common driver. When someone asks a decision-stage question and an AI Overview answers it in full, the person who no longer clicks was often the one closest to buying.
Coverage of studies on AI Overviews hurting clicks points to the loss concentrating on exactly the queries that used to carry researchers to your site, so you are left with a similar number of visits but a weaker mix of intent.
Click behaviour compounds it. Backlinko's study of organic click-through rates shows how heavily clicks concentrate at the very top of the results, so when an overview or feature pushes you down or answers above you, the clicks you lose are disproportionately the valuable ones.
A small drop in ranking or a new overview can remove your most commercial clicks while your softer, informational traffic carries on unaffected. Winning that intent back is what search intent optimisation is built to do.
This is why two sites can report the same percentage traffic loss and see wildly different lead outcomes. One lost a slab of low-value informational reads and barely felt it.
The other lost the exact queries that signalled someone was ready to buy, and watched its pipeline empty. The headline number was identical, but the intent behind the lost visits was not, and intent is what converts.
Diagnosing the drop without looking at intent is like weighing a shopping basket without checking what is in it.
The assist problem: traffic that fed later conversions
Some of your lost visitors never converted on the visit you are measuring, and that makes their loss easy to overlook. They read a guide, learned to trust you, left, and came back weeks later to enquire. The first visit assisted a conversion it never got credit for.
When AI absorbs that early research visit, the later conversion it would have produced simply never happens, and it shows up as a lead drop with no obvious traffic cause.
Ruler Analytics' attribution research makes the point that content frequently assists revenue that last-touch reporting hands to another channel, so losing the assist layer hits leads on a delay. This is why the lead drop can lag the traffic drop by weeks and feel disconnected from it.
Diagnose it by looking at assisted conversions and multi-touch paths, not just last-click. If your informational content used to appear early in conversion paths and has since lost traffic, you have likely found a hidden cause.
The fix is to keep that content visible as a cited source even when the click disappears, which is a core aim of bringing traffic back with AEO.
Page or source: is conversion rate down, or the traffic mix?
There is one more fork to resolve. Either your pages got worse at converting, or your traffic got worse in composition. They look identical in a leads report and need completely different fixes.
Isolate it by comparing conversion rate within a single, stable segment. If organic visitors to a specific money page convert at the same rate as before but there are simply fewer of them, your pages are fine and the problem is traffic.
If the same page's conversion rate itself fell, the page or the offer is the issue. Unbounce's conversion benchmark data is useful context here for judging whether a page's rate is reasonable or genuinely underperforming.
Most of the time, this fork resolves towards traffic composition rather than page quality, especially when nothing on the page changed. That points the fix upstream, at recovering the high-intent visibility you lost, rather than at endlessly tweaking a page that was already converting well.
Redesigning a page that was never the problem is one of the most common and expensive wrong turns in this whole diagnosis. Getting that visibility back means being surfaced across ChatGPT search and Perplexity, not just traditional results.
What the real problem usually is, and how to fix it
Put the diagnosis together and a familiar picture emerges. The traffic total moved a little, but the valuable slice moved a lot, because AI answers and search features intercepted your highest-intent visitors and your assist content. The leads collapsed because leads always came from that slice.
The fix follows the diagnosis. Recover high-intent visibility by becoming the source AI cites for decision-stage questions, so you appear even when the click is scarce.
Strengthen the specific pages and queries that drove leads, and make sure they answer the exact questions buyers ask before acting. Then capture the warmer, smaller click stream that remains with sharper calls to action and a low friction path to enquire.
Spreading that visibility to Google's AI answers closes the loop on where the intent went.
Above all, resist the reflex to chase raw volume to replace the leads. More low-intent traffic will not refill a high-intent hole, and it hides the real problem behind a healthier-looking chart. Fix the composition, and the leads return faster than the traffic total does.
What this looks like in practice
The pattern repeats across businesses that felt this squeeze. Traffic slid a little, leads slid a lot, and the panic began with the wrong number. The ones who recovered did not chase volume.
They segmented, found that a handful of decision-stage pages had lost their highest-intent clicks, and rebuilt those pages to be cited by AI while tightening the offer on each.
Within a couple of reporting cycles, the enquiries returned even though the raw traffic total stayed lower than before, because the visitors who did arrive were the right ones again.
Our case study shows the same logic play out: visibility and leads recovered by fixing the quality and structure of what ranked, not by pouring in more undifferentiated traffic.
The lesson is consistent. A leads problem that looks like a traffic problem is almost always a composition problem, and composition is fixable once you can see it clearly.
How to prevent it happening again
Prevention is mostly instrumentation. Once you have diagnosed one of these, set up your reporting so the next one is obvious in a week, not a quarter.
Track leads by landing page and by intent, not just site-wide, so a concentrated loss surfaces immediately. Watch impressions against clicks on your money-driving pages to catch the moment an overview starts intercepting them.
Keep an eye on assisted conversions so a weakening assist layer shows up before it drags down last-touch leads. A structured AI visibility audit run regularly turns all of this into an early-warning system rather than a post-mortem.
Then diversify, so no single change can gut your pipeline again. Build direct, email and referral demand alongside search, and align the whole effort with an AI SEO plan that treats visibility and conversion as one system.
Start from your home base, instrument the funnel properly, and a small traffic drop stays a small problem.
Pairing solid measurement with strong structured data keeps both your pages and your reporting legible as search keeps shifting.


.svg)
.svg)
.svg)
.svg)
.svg)



.svg)

.svg)


.svg)
.svg)
.svg)

.svg)
.svg)